On 15 November 2026 the poll average puts Marine Le Pen first with 33.3% (90% interval 31.5 to 35.3). Carried to election day, the polls give her a 96% chance of reaching the run-off and 89% of winning.
observed = published data (polls, page views). modelled = Bayesian model estimates, with 90% credible intervals.

Where do these numbers come from? A percentage like 33% for Le Pen is not a single poll: it is the estimate of a statistical model that combines every first-round poll published since 30 September 2025: 59 polls from 9 institutes (Cluster17, Elabe, HarrisInteractive, Ifop, Ipsos, Odoxa, OpinionWay, Verian, YouGov), the latest finished on 13 November 2026. The model weights each poll by its sample size, corrects for each institute's usual lean and for the fact that polls do not all offer the same list of candidates, then tracks each candidate day by day. For Le Pen, the average is 33.3% on 15 November (90% likely range: 32 to 35); the institutes' latest polls put Le Pen between 27% and 36%. Only declared candidates are shown. The polls are taken from the Wikipedia list (CC BY-SA 4.0); the full list is below and the method is on the “Method and data” page.
The 59 polls used
| Institute | Fieldwork | Sample |
|---|---|---|
| Elabe | 12 November – 13 November | 1 500 |
| OpinionWay | 10 November – 12 November | 964 |
| Cluster17 | 9 November – 10 November | 1 164 |
| OpinionWay | 9 November – 10 November | 982 |
| HarrisInteractive | 3 November – 5 November | 2 101 |
| Ifop | 27 October – 29 October | 1 501 |
| Cluster17 | 19 October – 22 October | 3 000 |
| Ipsos | 21 October – 22 October | 1 500 |
| OpinionWay | 21 October – 22 October | 973 |
| HarrisInteractive | 19 October – 21 October | 2 094 |
| Ifop | 17 October – 19 October | 1 928 |
| Elabe | 14 October – 16 October | 1 701 |
| Cluster17 | 14 October – 15 October | 1 263 |
| YouGov | 12 October – 15 October | 1 094 |
| Ifop | 12 October – 14 October | 1 390 |
| OpinionWay | 13 October – 14 October | 1 043 |
| HarrisInteractive | 5 October – 8 October | 2 004 |
| Odoxa | 24 September – 7 October | 12 005 |
| Ifop | 25 September – 29 September | 1 527 |
| HarrisInteractive | 22 September – 24 September | 1 974 |
| YouGov | 17 September – 21 September | 1 103 |
| Cluster17 | 15 September – 16 September | 1 943 |
| Ifop | 9 September – 11 September | 1 548 |
| HarrisInteractive | 8 September – 10 September | 2 052 |
| OpinionWay | 9 September – 10 September | 1 001 |
| Ipsos | 3 September – 9 September | 13 060 |
| OpinionWay | 8 September – 9 September | 1 001 |
| OpinionWay | 2 September – 4 September | 1 034 |
| OpinionWay | 2 September – 3 September | 1 003 |
| Ipsos | 31 August – 2 September | 1 500 |
| Cluster17 | 31 August – 1 September | 1 711 |
| Elabe | 26 August – 28 August | 1 501 |
| Ifop | 24 August – 25 August | 1 598 |
| HarrisInteractive | 18 August – 19 August | 1 764 |
| Cluster17 | 22 July – 24 July | 1 506 |
| Elabe | 9 July – 10 July | 1 503 |
| Verian | 8 July – 10 July | 1 047 |
| OpinionWay | 8 July – 9 July | 963 |
| HarrisInteractive | 7 July – 8 July | 1 592 |
| Ifop | 7 July – 8 July | 984 |
| Ifop | 22 June – 24 June | 1 415 |
| OpinionWay | 10 June – 11 June | 1 001 |
| Ifop | 26 May – 28 May | 1 501 |
| Ipsos | 27 May – 28 May | 1 500 |
| HarrisInteractive | 25 May – 27 May | 1 744 |
| Odoxa | 20 May – 21 May | 1 005 |
| HarrisInteractive | 28 April – 30 April | 1 725 |
| HarrisInteractive | 22 April | 2 000 |
| Elabe | 25 March – 27 March | 1 504 |
| OpinionWay | 26 March – 27 March | 1 009 |
| Odoxa | 25 March – 26 March | 1 299 |
| HarrisInteractive | 22 March | 1 062 |
| Ifop | 26 February – 27 February | 1 393 |
| Ifop | 1 February – 6 February | 1 137 |
| Odoxa | 19 November – 20 November | 1 300 |
| Verian | 18 November – 20 November | 938 |
| Elabe | 30 October – 31 October | 1 396 |
| HarrisInteractive | 7 October | 1 289 |
| Cluster17 | 30 September – 1 October | 1 531 |
1
2
 3
 4
 5
 6
 7
 8
Poll average on 15 November 2026 (90% likely range); chances according to the polls carried to election day. Arrows: movement over the last 30 days, shown only when it stands out from noise (see “Who's rising?”).
All the numbers
| Candidate | Polls (%) | Win: polls | Run-off: polls |
|---|---|---|---|
| Marine Le Pen | 33.3 | 89% | 96% |
| Jean-Luc Mélenchon | 17.2 | <1% | 47% |
| Édouard Philippe | 11.8 | 5% | 24% |
| Raphaël Glucksmann | 11.2 | 2% | 20% |
| David Lisnard | 8.7 | 4% | 11% |
| Bruno Retailleau | 6.4 | 1% | 5% |
| Gabriel Attal | 5.5 | 1% | 4% |
| Éric Zemmour | 3.9 | 1% | 2% |
| Marine Tondelier | 2.7 | <1% | 1% |
| Nicolas Dupont-Aignan | 2.0 | <1% | <1% |
| Fabien Roussel | 1.9 | <1% | <1% |
| Nathalie Arthaud | 0.7 | <1% | <1% |
No clear change in the poll average over the last 14 days.
- 5 new polls (Cluster17; Elabe; HarrisInteractive; OpinionWay) ; poll tables through 13 November
- 0 tension week(s) above the shock threshold (ACLED, weeks through 23 October)
- 1 online attention spikes (Zemmour)
- 0 dated events in the calendar
| Candidate | Poll average over the window | Poll average (points) | Rank in the polls |
|---|---|---|---|
| Marine Le Pen | −0.1 (no clear change) | 1 | |
| Jean-Luc Mélenchon | +0.2 (no clear change) | 2 | |
| Édouard Philippe | −0.1 (no clear change) | 3 | |
| Raphaël Glucksmann | −0.1 (no clear change) | 4 | |
| David Lisnard | +1.1 (no clear change) | 5 | |
| Bruno Retailleau | −0.1 (no clear change) | 6 | |
| Gabriel Attal | +0.0 (no clear change) | 7 | |
| Éric Zemmour | +0.0 (no clear change) | 9 | |
| Marine Tondelier | +0.0 (no clear change) | 10 | |
| Nicolas Dupont-Aignan | +0.0 (no clear change) | 11 | |
| Fabien Roussel | +0.0 (no clear change) | 12 | |
| Nathalie Arthaud | +0.0 (no clear change) | 13 |
Polls: 1 November to 15 November.
An arrow appears only when the change is distinguishable from noise: the 90% interval of the difference excludes zero and the change exceeds 0.5 points in the poll average. Otherwise: “no clear change”. Details in Method.
No clear change in the poll average over the last 7 days.
- 4 new polls (Cluster17; Elabe; OpinionWay) ; poll tables through 13 November
- 0 tension week(s) above the shock threshold (ACLED, weeks through 23 October)
- 1 online attention spikes (Zemmour)
- 0 dated events in the calendar
| Candidate | Poll average over the window | Poll average (points) | Rank in the polls |
|---|---|---|---|
| Marine Le Pen | +0.0 (no clear change) | 1 | |
| Jean-Luc Mélenchon | +0.0 (no clear change) | 2 | |
| Édouard Philippe | +0.0 (no clear change) | 3 | |
| Raphaël Glucksmann | +0.0 (no clear change) | 4 | |
| David Lisnard | +0.1 (no clear change) | 5 | |
| Bruno Retailleau | +0.0 (no clear change) | 6 | |
| Gabriel Attal | +0.0 (no clear change) | 7 | |
| Éric Zemmour | +0.0 (no clear change) | 9 | |
| Marine Tondelier | +0.0 (no clear change) | 10 | |
| Nicolas Dupont-Aignan | +0.0 (no clear change) | 11 | |
| Fabien Roussel | +0.0 (no clear change) | 12 | |
| Nathalie Arthaud | +0.0 (no clear change) | 13 |
Polls: 8 November to 15 November.
An arrow appears only when the change is distinguishable from noise: the 90% interval of the difference excludes zero and the change exceeds 0.5 points in the poll average. Otherwise: “no clear change”. Details in Method.
David Lisnard gained 2.8 points in the poll average over the last 30 days.
- 11 new polls (Cluster17; Elabe; HarrisInteractive; Ifop; Ipsos; OpinionWay) ; poll tables through 13 November
- 1 tension week(s) above the shock threshold (ACLED, weeks through 23 October)
- 7 online attention spikes (Arthaud, Le Pen, Roussel, Zemmour)
- 0 dated events in the calendar
| Candidate | Poll average over the window | Poll average (points) | Rank in the polls |
|---|---|---|---|
| Marine Le Pen | +0.0 (no clear change) | 1 | |
| Jean-Luc Mélenchon | +0.8 (no clear change) | 2 | |
| Édouard Philippe | −0.5 (no clear change) | 3 | |
| Raphaël Glucksmann | −0.2 (no clear change) | 4 | |
| David Lisnard | ▲ +2.8 | ▲ +1 | |
| Bruno Retailleau | −0.2 (no clear change) | ▼ −1 | |
| Gabriel Attal | −0.2 (no clear change) | 7 | |
| Éric Zemmour | −0.1 (no clear change) | 9 | |
| Marine Tondelier | +0.0 (no clear change) | 10 | |
| Nicolas Dupont-Aignan | +0.0 (no clear change) | 11 | |
| Fabien Roussel | +0.0 (no clear change) | 12 | |
| Nathalie Arthaud | +0.0 (no clear change) | 13 |
Polls: 16 October to 15 November.
An arrow appears only when the change is distinguishable from noise: the 90% interval of the difference excludes zero and the change exceeds 0.5 points in the poll average. Otherwise: “no clear change”. Details in Method.
| Date | Sources updated | Rows added | Commit |
|---|---|---|---|
| 2026-11-16 15:51:00 | pageviews; gdelt | pageviews +13; gdelt +2 | 470c68f |
| 2026-11-15 16:28:00 | polls; pageviews; gdelt; poll_model | polls +165; pageviews +65; gdelt +10; poll_model +78 | 37805ff |
| 2026-11-10 05:04:00 | polls | polls +53 | f9508b9 |
| 2026-11-10 04:41:00 | polls; pageviews; gdelt | polls +-53; pageviews +13; gdelt +4 | 37d952e |
| 2026-11-09 11:25:00 | polls; pageviews; gdelt; poll_model | polls +53; pageviews +65; gdelt +8; poll_model +117 | c346582 |
| 2026-11-05 05:34:00 | pageviews; gdelt | pageviews +13; gdelt +2 | 9126ef0 |
| 2026-11-04 11:56:00 | none | 0 | 078ce17 |
| 2026-11-04 11:42:00 | none | 0 | 078ce17 |
| 2026-11-04 06:40:00 | polls; pageviews; acled; gdelt; events; poll_model | polls +43; pageviews +91; acled +1; gdelt +14; events +2; poll_model +65 | 49df6fb |
| 2026-10-29 16:03:00 | none | 0 | 1599e5c |
On the order, yes. All 7 institutes put Le Pen first and Mélenchon second; 6 of 7 put Glucksmann third.
- On the numbers, they are as close as in 2017 and 2022: allowing for each institute's usual lean, polls differ from one another by about 1.6 times what sampling chance alone would produce (1.5 and 1.5 in 2017 and 2022).
- One exception: Le Pen's figures are closer from one institute to the next than sampling chance would allow, as in 2017. This can come from shared methods (weighting on past vote) or from institutes avoiding standing out; the data cannot tell which.
- Clear institute leans: Cluster17 puts Le Pen 2.4 points lower; Cluster17 puts Mélenchon 1.8 point higher; YouGov puts Philippe 1.2 point lower than the average institute.
Table
| Institute | Fieldwork | Attal | Glucksmann | Le Pen | Mélenchon | Philippe | Retailleau |
|---|---|---|---|---|---|---|---|
| Elabe | 12 November | 5.5 | 13.0 | 33.0 | 17.5 | 12.0 | 6.0 |
| OpinionWay | 11 November | 4.0 | 11.0 | 32.0 | 16.0 | 12.0 | 5.0 |
| Cluster17 | 9 November | 2.0 | 8.0 | 27.0 | 19.0 | 8.0 | 5.0 |
| HarrisInteractive | 4 November | 6.0 | 11.0 | 36.0 | 18.0 | 11.0 | 7.0 |
| Ifop | 28 October | 5.0 | 10.0 | 35.0 | 18.0 | 9.5 | 4.0 |
| Ipsos | 21 October | 4.0 | 13.0 | 33.5 | 17.0 | 13.0 | 7.5 |
| YouGov | 13 October | 6.0 | 12.0 | 36.0 | 15.0 | 10.0 | 6.0 |
How do we know?
The order: candidates are ranked in each institute's latest poll and the agreement between those rankings is measured (Kendall's W: 0 = no agreement, 1 = the same order everywhere; here 0.95).
The gaps: each poll is compared with the average of the other institutes' polls of the same fortnight. The observed gap is set against the gap that sampling chance alone would produce (sample size and the candidate's score), before and after removing each institute's usual lean. The same calculation is run on the last six months of the 2017 and 2022 campaigns.
The leans are those of the main poll model; only those whose 90% range excludes zero are quoted.
With 153 days to go, the range of likely scores is still wide: polls are a starting point, not a result.
Bands: 50%, 80%, 90% and 98% chance; black tick: median. Uncertainty is wide six months out: it includes the polling error measured in 2017 and 2022.
| Candidate | Mean | 5% | 25% | 50% | 75% | 95% |
|---|---|---|---|---|---|---|
| Marine Le Pen | 33.1 | 19.1 | 26.9 | 32.6 | 38.8 | 49.0 |
| Jean-Luc Mélenchon | 17.2 | 7.1 | 11.9 | 16.2 | 21.4 | 31.0 |
| Édouard Philippe | 11.9 | 3.9 | 7.4 | 10.7 | 15.0 | 23.7 |
| Raphaël Glucksmann | 11.2 | 3.5 | 6.8 | 10.0 | 14.2 | 22.9 |
| David Lisnard | 10.0 | 1.0 | 3.5 | 7.4 | 13.5 | 27.9 |
| Bruno Retailleau | 6.4 | 1.4 | 3.1 | 5.2 | 8.1 | 15.2 |
| Gabriel Attal | 5.4 | 1.0 | 2.5 | 4.2 | 7.0 | 13.9 |
| Éric Zemmour | 3.8 | 0.6 | 1.4 | 2.7 | 4.9 | 10.9 |
| Marine Tondelier | 2.7 | 0.3 | 0.9 | 1.7 | 3.3 | 8.3 |
| Nicolas Dupont-Aignan | 2.1 | 0.2 | 0.6 | 1.3 | 2.5 | 6.6 |
| Fabien Roussel | 1.9 | 0.2 | 0.6 | 1.2 | 2.3 | 6.0 |
| Nathalie Arthaud | 0.7 | 0.1 | 0.2 | 0.4 | 0.8 | 2.0 |
| Candidate | Run-off, polls | Win, polls |
|---|---|---|
| Marine Le Pen | 96% | 92% |
| Jean-Luc Mélenchon | 54% | <1% |
| Édouard Philippe | 20% | 4% |
| Raphaël Glucksmann | 18% | 2% |
| David Lisnard | 19% | 7% |
| Bruno Retailleau | 5% | 1% |
| Gabriel Attal | 4% | <1% |
| Éric Zemmour | 2% | 1% |
| Marine Tondelier | 1% | <1% |
| Nicolas Dupont-Aignan | <1% | <1% |
| Fabien Roussel | <1% | <1% |
| Nathalie Arthaud | <1% | <1% |
Lisnard's chances are read in a line-up where Lisnard is added to the core list. For most candidates other than Le Pen and Philippe, the chance of winning rests mainly on run-offs never polled.
Weeks of unusual social tension (protests above the threshold). A movement during these weeks is not necessarily caused by them. ACLED, accessed on 2026-11-01. www.acleddata.com
| Candidate | 2 August 2026 | 1 October 2026 | 31 October 2026 |
|---|---|---|---|
| Marine Le Pen | 32.6 | 33.1 | 33.2 |
| Jean-Luc Mélenchon | 14.8 | 16.0 | 16.3 |
| Édouard Philippe | 13.5 | 12.9 | 12.7 |
| Raphaël Glucksmann | 9.7 | 10.7 | 11.7 |
| David Lisnard | 4.1 | 5.3 | 7.4 |
| Bruno Retailleau | 7.0 | 6.7 | 6.7 |
| Gabriel Attal | 6.6 | 6.0 | 5.7 |
| Éric Zemmour | 4.0 | 4.0 | 4.0 |
| Marine Tondelier | 3.1 | 2.9 | 2.7 |
| Nicolas Dupont-Aignan | 2.0 | 2.0 | 2.0 |
| Fabien Roussel | 2.2 | 2.0 | 2.0 |
| Nathalie Arthaud | 0.8 | 0.7 | 0.6 |
- Jean-Luc Mélenchon is gaining ground: about 0.2 to 0.3 points a week over the last month.
- Bruno Retailleau is probably slipping: about 0.1 to 0.3 points a week.
- The others are not clearly moving.
- The race for second place, which decides who faces Marine Le Pen in the run-off, is open. Jean-Luc Mélenchon holds it today, but Édouard Philippe has about 3 chances in 10 of finishing ahead on 18 April, and Raphaël Glucksmann about 3 chances in 10.
- But trends rarely last: in 2017 and 2022, extending the past month's trend made forecasts worse, not better.
● clearly rising ● probably falling ● no clear movement ◇ main poll model (slower). The line shows the likely range (9 chances in 10). Polls through 12 November 2026.
These 30 days include weeks of unusual social tension (from 10 October 2026). A movement over this period is not necessarily caused by them. ACLED, accessed on 2026-11-01. www.acleddata.com
How do we know?
Each poll is corrected for its pollster's usual lean (estimated by the main model); a filter then follows each candidate's share day by day, separating real movement from polling noise (a Kalman filter). The speed is the change in that share over the period, per week; the range comes from the same calculation.
The diamond shows the same speed read on the main model's poll average, which is smoother and so slower. Both agree on the direction; the true speed is probably in between.
● clearly rising ● probably falling ● no clear movement ◇ main poll model (slower). The line shows the likely range (9 chances in 10). Polls through 12 November 2026.
How do we know?
Each poll is corrected for its pollster's usual lean (estimated by the main model); a filter then follows each candidate's share day by day, separating real movement from polling noise (a Kalman filter). The speed is the change in that share over the period, per week; the range comes from the same calculation.
The diamond shows the same speed read on the main model's poll average, which is smoother and so slower. Both agree on the direction; the true speed is probably in between.
| Candidate | Speed over 30 days (pt/week, range) | Chance it is rising | Main model (pt/week) | Speed over 14 days | Pace | Chance of reaching the run-off: change (pt/week) |
|---|---|---|---|---|---|---|
| Marine Le Pen | −0.04 (−0.18 ; 0.10) | 32% | −0.01 | −0.07 (−0.28 ; 0.15) | about the same pace | +0.19 (unusually fast) |
| Jean-Luc Mélenchon | +0.27 (0.03 ; 0.50) | 97% | +0.19 | +0.08 (−0.41 ; 0.58) | about the same pace | +0.40 (fast) |
| Édouard Philippe | −0.32 (−0.74 ; 0.10) | 10% | −0.12 | +0.13 (−0.78 ; 1.04) | about the same pace | −0.56 (fast) |
| Raphaël Glucksmann | −0.16 (−0.44 ; 0.12) | 17% | −0.04 | −0.12 (−0.66 ; 0.42) | moving down faster than the month before | +0.64 (unusually fast) |
| Bruno Retailleau | −0.26 (−0.54 ; 0.03) | 7% | −0.05 | −0.20 (−0.75 ; 0.34) | about the same pace | −0.23 (unusually fast) |
| Gabriel Attal | −0.17 (−0.60 ; 0.26) | 25% | −0.05 | −0.13 (−0.91 ; 0.65) | about the same pace | −0.26 (unusually fast) |
| Éric Zemmour | −0.01 (−0.04 ; 0.03) | 38% | −0.01 | −0.01 (−0.06 ; 0.04) | about the same pace | −0.08 (unusually fast) |
| Marine Tondelier | −0.01 (−0.11 ; 0.09) | 45% | −0.01 | +0.02 (−0.14 ; 0.19) | about the same pace | −0.06 (unusually fast) |
| Nicolas Dupont-Aignan | +0.00 (−0.01 ; 0.01) | 49% | +0.01 | +0.00 (−0.02 ; 0.02) | about the same pace | −0.01 (fast) |
| Fabien Roussel | −0.05 (−0.13 ; 0.02) | 13% | −0.01 | −0.03 (−0.16 ; 0.10) | about the same pace | −0.01 (usual) |
1st place · Le Pen / Mélenchon
Gap today: 16.1 points.
At the current pace, Mélenchon would not catch Le Pen before the vote (about 52 weeks needed; 22 left).
Chance Mélenchon finishes ahead of Le Pen on 18 April: about 1 in 10
2nd place: who reaches the run-off · Mélenchon / Philippe
Gap today: 5.4 points.
At the current pace, the gap is not closing.
Chance Philippe finishes ahead of Mélenchon on 18 April: about 3 in 10
2nd place: who reaches the run-off · Mélenchon / Glucksmann
Gap today: 6.0 points.
At the current pace, the gap is not closing.
Chance Glucksmann finishes ahead of Mélenchon on 18 April: about 3 in 10
3rd place · Philippe / Glucksmann
Gap today: 0.7 point.
At the current pace, Glucksmann would catch Philippe in about 4 weeks (22 left), if the trend holds.
Chance Glucksmann finishes ahead of Philippe on 18 April: about 5 in 10
How do we know?
The chances come from the model's simulation: the poll average of 15 November 2026 is carried to 18 April 16,000 times, with the movement the campaign can still produce and the gap seen in 2017 and 2022 between polls taken as far from the vote and the result. We count the share of simulations in which the candidate behind today finishes ahead.
Without that historical gap, keeping only the campaign movement the model estimates from the past year, these chances would be much lower (Mélenchon ahead of Le Pen: <1%, Philippe ahead of Mélenchon: 3%, Glucksmann ahead of Mélenchon: 3%, Glucksmann ahead of Philippe: 37%). Most of the uncertainty therefore comes from polls six months out having often been several points off.
The "current pace" extends the speed of the last 30 days: it is a what-if, not a forecast (see "Do trends last?").
Not for long. A rise or fall in the polls says very little about what comes next.
We replayed the 2017 and 2022 campaigns week by week: at each date, did the past month's trend, extended, predict what followed? In 2017, about a third of a trend carried on over two weeks (the rises of Macron and Mélenchon, Fillon's fall). In 2022, nothing carried on, and several surges reversed at the end (Zemmour, Pécresse). On election day, extending the trend nearly doubled the error.
| Campaign | Does the month's trend carry on for 2 weeks? | … and for a month? | Error on election day: extending the trend vs "no more change" |
|---|---|---|---|
| 2017 | partly (about 32%) | no | 6.8 pts vs 3.5 |
| 2022 | no | no | 9.3 pts vs 5.2 |
| 2027 (so far) | no, it tended to reverse | no, it tended to reverse | – |
That is why this page shows who is moving now but does not extend the lines: the chances in "Could the order change?" come from the model, not from an extended trend.
How do we know?
For each candidate and each week of the last six months of the campaign, the candidate's level is estimated from the polls known on that date only; the trend is measured over the 30 days ending a week earlier. Three forecasts of the level 14 or 30 days later (or of the result) are then compared: "no more change", "the trend carries on", "half the trend carries on". The share of the trend that carries on is estimated allowing for the dependence between weeks of the same candidate (resampling by candidate).
According to the polls carried to election day, out of 100 simulated elections:
Weeks of unusual social tension (protests above the threshold). A movement during these weeks is not necessarily caused by them. ACLED, accessed on 2026-11-01. www.acleddata.com
Chances derived from the poll average carried to 18 April 2027 with the error measured in 2017 and 2022, then from the run-off model. Current estimates derived from prediction markets are not published on this site; the paper's result at 31 October 2026 is summarised below.
The paper behind this site compares the polls with the prediction markets. Its result, on 31 October 2026:
The markets doubt Le Pen's run-off, which the polls of 2017 and 2022 overstated for her (see the Scenarios tab), not her first round. The analysis is exploratory; a registered evaluation follows the run-off of 2 May 2027.
Published results of the preprint, frozen at its cut-off and not updated; this site publishes no market prices. Read the paper (SocArXiv)
| Candidate | Share (%) | Views per day (fr) |
|---|---|---|
| Marine Le Pen | 4.4 | 2,598 |
| Jean-Luc Mélenchon | 13.9 | 7,990 |
| Édouard Philippe | 4.6 | 2,640 |
| Raphaël Glucksmann | 12.8 | 7,147 |
| David Lisnard | 34.5 | 20,849 |
| Bruno Retailleau | 6.7 | 3,896 |
| Gabriel Attal | 3.8 | 2,239 |
| Éric Zemmour | 7.7 | 4,537 |
| Marine Tondelier | 4.7 | 2,984 |
| Nicolas Dupont-Aignan | 1.5 | 861 |
| Fabien Roussel | 2.1 | 1,235 |
| Nathalie Arthaud | 1.2 | 715 |
| Date | Candidate | Type | Attention on the day (× normal) |
|---|---|---|---|
| 19 April 2026 | Bruno Retailleau | nomination | ×3.7 * |
| 3 May 2026 | Jean-Luc Mélenchon | nomination | ×6.4 * |
| 7 July 2026 | Marine Le Pen | court ruling | ×13.2 * |
| 15 July 2026 | Marine Le Pen | other | ×1.1 |
| 23 August 2026 | Raphaël Glucksmann | candidacy announcement | ×6.0 * |
| 6 September 2026 | Jean-Luc Mélenchon | candidacy announcement | ×1.1 |
| 6 September 2026 | Fabien Roussel | candidacy announcement | ×16.9 * |
| 17 September 2026 | Éric Zemmour | candidacy announcement | ×4.6 * |
| 29 September 2026 | Nathalie Arthaud | lycée protests | ×7.9 * |
| 29 September 2026 | Jean-Luc Mélenchon | lycée protests | ×2.2 * |
| 1 October 2026 | Jean-Luc Mélenchon | lycée protests | ×1.8 * |
| 7 October 2026 | Jean-Luc Mélenchon | lycée protests | ×2.1 * |
| 7 October 2026 | Marine Tondelier | lycée protests | ×0.2 * |
| 11 October 2026 | Raphaël Glucksmann | nomination | ×5.8 * |
Orange bars: weeks whose protest count exceeds the median of the 26 preceding weeks by more than three median absolute deviations (pre-registered rule).
Not in the polls, so far. During the lycée protests, attention shifted towards Mélenchon and Arthaud; voting intentions did not move measurably.
- Polls: after a shock-week day the poll average moves by less than 0.006 (log-odds), under a tenth of a point, and no more than in randomly chosen weeks.
- Attention: Mélenchon's share of page views was multiplied by 1.8 to 2.2 on the days of action, Arthaud's by up to 8; Tondelier's and Roussel's fell.
- Not final yet: the ACLED data stop at the week of 17 October and will be revised, and the effect is measured up to three weeks after a shock.
Response of online attention to shock-week days, all candidates (solid) and by bloc (dotted); the grey band shows what 200 random placements of the shock weeks give. Nothing clearly leaves the band. ACLED, accessed on 2026-11-01. www.acleddata.com
How do we know?
A week is a "shock" week when its protest count (ACLED) clearly exceeds that of the 26 weeks before (a rule set in advance). For each day of those weeks we measure how each series moved over the following 0 to 21 days, compared with other days (local projections). To tell whether a response is real, the calculation is redone 200 times with the shock weeks placed at random: a response that stays inside that band cannot be told apart from chance. The attention effects by day of action come from the event studies (the "Effects of campaign events" table).
The three most likely run-offs, and who would win:
Chance that this run-off happens: 43.7%. Pollsters have tested this run-off.
Run-off voting intention (current poll state, modelled)
Chance that this run-off happens: 21.9%. Pollsters have tested this run-off.
Run-off voting intention (current poll state, modelled)
Chance that this run-off happens: 18.4%. Pollsters have tested this run-off.
Run-off voting intention (current poll state, modelled)
Chance that this run-off happens: 4.8%. Pollsters have tested this run-off.
Run-off voting intention (current poll state, modelled)
Chance that this run-off happens: 3.5%. Pollsters have tested this run-off.
Run-off voting intention (current poll state, modelled)
Chance that this run-off happens: 1.8%. This run-off has never been polled: the result is a model inference, not a poll reading.
Chance that this run-off happens: 1.2%. Pollsters have tested this run-off.
Run-off voting intention (current poll state, modelled)
Chance that this run-off happens: 1.0%. This run-off has never been polled: the result is a model inference, not a poll reading.
Chance that this run-off happens: 0.9%. This run-off has never been polled: the result is a model inference, not a poll reading.
Chance that this run-off happens: 0.5%. This run-off has never been polled: the result is a model inference, not a poll reading.
Chance that this run-off happens: <1%. This run-off has never been polled: the result is a model inference, not a poll reading.
Chance that this run-off happens: <1%. This run-off has never been polled: the result is a model inference, not a poll reading.
Chance that this run-off happens: <1%. This run-off has never been polled: the result is a model inference, not a poll reading.
Chance that this run-off happens: <1%. This run-off has never been polled: the result is a model inference, not a poll reading.
Chance that this run-off happens: <1%. This run-off has never been polled: the result is a model inference, not a poll reading.
| Pairing | Chance of this pairing | First-named wins | Polled? |
|---|---|---|---|
| Marine Le Pen – Jean-Luc Mélenchon | 43.7% | >99% | yes |
| Marine Le Pen – Édouard Philippe | 21.9% | 84% | yes |
| Raphaël Glucksmann – Marine Le Pen | 18.4% | 6% | yes |
| Marine Le Pen – Bruno Retailleau | 4.8% | 93% | yes |
| Gabriel Attal – Marine Le Pen | 3.5% | 8% | yes |
| Marine Le Pen – Éric Zemmour | 1.8% | 67% | no (inferred) |
| Jean-Luc Mélenchon – Édouard Philippe | 1.2% | 1% | yes |
| Marine Le Pen – Marine Tondelier | 1.0% | 67% | no (inferred) |
| Raphaël Glucksmann – Jean-Luc Mélenchon | 0.9% | 91% | no (inferred) |
| Raphaël Glucksmann – Édouard Philippe | 0.5% | 37% | no (inferred) |
| Marine Le Pen – Fabien Roussel | <1% | 69% | no (inferred) |
| Nicolas Dupont-Aignan – Marine Le Pen | <1% | 41% | no (inferred) |
| Jean-Luc Mélenchon – Bruno Retailleau | <1% | 8% | no (inferred) |
| Gabriel Attal – Jean-Luc Mélenchon | <1% | 91% | no (inferred) |
| Édouard Philippe – Bruno Retailleau | <1% | 56% | no (inferred) |
Run-off chances are conditional: they assume the pairing happens, and are projected to 2 May 2027 with the error measured in 2017 and 2022. Run-off polls overstated Marine Le Pen by about 3.7 points in 2017 and 2022; that bias is not corrected here.
Prediction markets. The project also models Kalshi and Polymarket prices, but estimates derived from them are not published on this site until the venues' terms of use and the position of the French gambling regulator (ANJ) have been clarified.
Disclaimer. This site presents academic research. It is not a forecast to bet on and not financial advice. Prediction-market prices are shown as information about what their participants believe, never as a recommendation; the site links to no betting platform.
The project treats three families of signals as distinct things: polls measure stated preferences, prediction markets beliefs about the outcome, online attention engagement. Social tension and a calendar of dated events enter as shocks. The dashboard only reads saved model results; it re-estimates nothing.
Definitions
- Poll average (modelled): day-by-day estimate of first-round voting intention from a Bayesian state-space model that corrects for pollster and line-up effects. 90% credible interval: according to the model, there is a 90% chance the true value lies inside it.
- Poll-implied probability (modelled): the poll average carried to election day with the error polls made in 2017 and 2022, then turned into chances of reaching the run-off and of winning.
- Observed: data as published (a poll, a page-view count). Modelled: an estimate, always shown with its uncertainty.
- Line-up: the list of candidates a poll offers. Numbers are read in the core line-up (eleven candidates and “others”); Lisnard in the core line-up with Lisnard added. Only declared candidates are shown.
The “what changed” rule
For each candidate, the latest value of each series is compared with its value 7, 14 or 30 days earlier. The sd of the difference treats the two days as independent, which overstates it for smoothed series: the rule leans towards “no clear change”. An arrow appears only when the 90% interval of the difference (± 1.645 sd) excludes zero and the change reaches 0.5 points (poll average), 2 points (market chance of winning) or 0.25 logit (gap). A change of rank is flagged only when the candidate is now clearly distinguishable from the one it passed. Summary sentences mention only changes that pass this rule.
Poll averages and market beliefs only change when the models are refitted (every two weeks, more often during the campaign). Daily updates concern observed data: new polls, attention, tension weeks.
The models, one paragraph each
M1, polls. Bayesian state-space model (Stan) of first-round voting intention: a random walk per candidate on weekly knots, pollster effects, and transfers between candidates when a name is missing from a line-up. Calibrated in real time on 2017 and 2022. Refitted every two weeks.
M2, markets. Coherent Bayesian model of Kalshi and Polymarket prices: win, qualification and place probabilities add up properly across candidates. Winning is identified over the whole period, qualification from 1 June 2026, first place only weakly.
M3, decomposition. The poll average is carried to 18 April 2027 (16,000 simulations, calibrated error), then to the run-off by a Bradley–Terry model of the polled pairings, which also infers the pairings never polled. The gap to the market belief is modelled with jumps at dated events. Sensitivity: with half or double the polling error, Le Pen's win gap runs from −3.95 to −1.31 logits; its sign does not change.
M4, attention and co-movement. Gaussian graphical model (lasso) in rolling 61-day windows over the daily changes of polls, prices and attention; lead-lag tests; event studies. Main result: few links between families day to day, except around 7 July 2026.
M5, tension shocks. A week is a “shock week” when its protest count (ACLED) exceeds the median of the preceding 26 weeks by three median absolute deviations. Local projections with placebo inference, and an interrupted time series for the September 2026 wave. Result: an analysis plan and a null.
M6, archived forecasts. Each day a dated forecast is written once and for all, chained by SHA-256; the site shows the latest. The polls–markets combination is an equal-weight logit average, fixed before the election.
M7, pre-registration. Hypotheses, rules and parameters are frozen on 31 January 2027 and deposited on the OSF.
The paper reads "real-time" values, which use only the polls published by each date; this site shows the smoothed average, which also uses later polls. The two can differ by a few tenths of a point.
Sources, licences and attribution
| Source | Licence / terms | Published here | Last observation | Attribution |
|---|---|---|---|---|
| Wikipedia poll tables (fr and en) | CC BY-SA 4.0 | poll-level shares of the modelling set (CC BY-SA 4.0) | 13 November 2026 | Wikipedia, 'Liste de sondages sur l'élection présidentielle française de 2027' (fr) and the English list; CC BY-SA 4.0. Polls are those of the named organisations. |
| Commission des sondages (notice register) | public register | not published (used to match notices) | – | Commission des sondages, register of notices. |
| Kalshi (public market data API) | no data licence located; derived estimates only | nothing for now (venue terms) | 31 October 2026 | Kalshi Inc., public market data; derived model estimates only. |
| Polymarket (Gamma and CLOB public APIs) | no data licence located; derived estimates only | nothing for now (venue terms) | 31 October 2026 | Polymarket, public market data; derived model estimates only. |
| Wikimedia REST API, daily pageviews | CC0 1.0 | daily views and attention shares | 15 November 2026 | Wikimedia Foundation, Pageviews API (CC0 1.0). |
| ACLED (Armed Conflict Location & Event Data) | ACLED EULA and Attribution Policy | weekly national aggregates and the shock rule only | 23 October 2026 | ACLED (Armed Conflict Location & Event Data), accessed on 2026-11-01 (www.acleddata.com); France, from 1 January 2020, protests, riots and violence against civilians, aggregated by the author to weekly national counts. |
| GDELT 2.0 event stream | open; citation requested | daily counts (protest, assault) in France | 15 November 2026 | The GDELT Project (www.gdeltproject.org). |
| Event calendar (hand-curated, sourced) | CC BY 4.0 (this project) | full calendar with sources | 17 October 2026 | Hand-curated calendar, one source per entry (events.csv). |
Raw Kalshi and Polymarket prices, candles and volumes are never published: only model estimates derived from them. ACLED data appear only as national weekly aggregates, with no downloadable file of the counts.
Photo credits


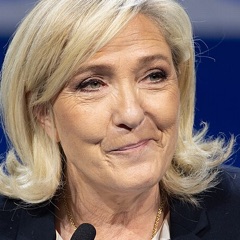
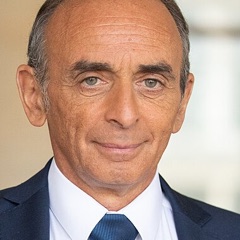
Each candidate's Wikipedia infobox photo, resized and cropped to a circle; the cropped versions of CC BY-SA 4.0 photos are shared under the same licence. No preference is implied by the choice of photo.
Data
This site offers no data files. The code and derived data behind the paper will be deposited, with a persistent identifier, in the OSF project (osf.io/78zse/) on acceptance; the poll tables come from Wikipedia (CC BY-SA 4.0). Kalshi and Polymarket quotes and ACLED event records are not redistributed, as their terms require.
Poll publication: the restricted period
French law (loi n° 77-808 of 19 July 1977, art. 11) forbids, for the presidential election, the publication, broadcasting and commentary of any election poll “from the Saturday before the vote at midnight” until the last polling station closes in metropolitan France. Article 1 treats “vote simulations based on polls” as polls: the average, the forecasts and the polls–markets combination are therefore withdrawn during these periods. The site removes them automatically, from 18:00 on the Thursday as a precaution (legal windows):
- 16 April 2027 00:00 → 18 April 2027 20:00
- 30 April 2027 00:00 → 2 May 2027 20:00
The polls cited are those published by the polling organisations; their notices can be consulted at the Commission des sondages. These dates are the author's reading, to be confirmed before the campaign.
Paper and contact
Prediction markets doubt Le Pen's run-off more than her first round: polls and prices in the 2027 French presidential campaign — preprint
The paper reads data to 31 October 2026; everything in it is exploratory. The pre-registration (a draft on the OSF) is frozen on 31 January 2027, and the registered evaluation follows the run-off of 2 May 2027.
Dhafer Malouche, Department of Mathematics and Statistics, College of Arts and Sciences, Qatar University. ORCID 0000-0002-0494-7141. Contact: dhafer.malouche@qu.edu.qa.
Site built 2026-11-16 15:51 (Paris time), code 470c68f. Project content under CC BY 4.0; data keep the licence of their source.